
Wine tourism is a major part of the Finger Lakes visitor economy, but measuring its scale is harder than it first appears.
There is no single official dataset showing how many unique wine tourists visit the Finger Lakes each year or exactly how much they spend. New York tourism reports measure a wider 14-county Finger Lakes tourism region. Wine-industry studies may cover all of New York State. Vineyard surveys use different geographic boundaries again, while historical winery studies do not always use the same definitions of visitors and visits.
This page brings together the strongest available Finger Lakes tourism, winery, vineyard and economic-impact data while keeping those differences visible. The main sources include Tourism Economics and Empire State Development, the New York Wine & Grape Foundation, the National Park Service, New York Agricultural Statistics Service research preserved by Cornell University, federal AVA records and county-level visitor studies.
Last updated: August 2026.
Visitor spending across the wider Finger Lakes tourism region
2024
Visitors in the latest full regional visitor-count study
2018
Share of leisure visitor spending classified as shopping at wineries
2018
Wineries across the Finger Lakes region
Current regional estimate
The years and definitions matter. These figures come from different studies and should not be combined as though they form a single annual statistical series.
Explore the Data Behind This Guide
The statistics on this page are backed by a source-level dataset containing
111 observations from 13 sources. It preserves original reported
values, definitions, geography, reference periods, source locations and documented
differences between figures that should not be treated as equivalent.
Download the research dataset (CSV)
111 observations · 13 sources
How Many Tourists Visit the Finger Lakes?
The most complete recent regional visitor-count study was commissioned by the Finger Lakes Tourism Alliance and conducted by Travel Market Insights using 2018 travel data.
The study reported approximately 5.56 million visitors to the Finger Lakes tourism region. Around 4.86 million were leisure visitors, with the remaining roughly 700,000 primarily traveling for business purposes.

Leisure visitors stayed an average of 3.4 days and 2.4 nights and generated approximately $2.432 billion in spending. The study covered New York’s 14-county Finger Lakes tourism region.[2][3]
| 2018 Finger Lakes visitor metric | Result |
|---|---|
| Total visitors | 5.56 million |
| Leisure visitors | 4.86 million |
| Business visitors | About 700,000 |
| Average stay | 3.4 days |
| Average nights | 2.4 nights |
| Leisure visitor spending | $2.432 billion |
Source note: Finger Lakes Tourism Alliance / Travel Market Insights, Comprehensive Regional Travel and Tourism Study and Recommendations, published in 2019 using 2018 visitor data. Key findings are preserved in later National Park Service and regional planning material.[2][3]
This remains useful as a regional visitor benchmark, but it should not be described as the number of people visiting in 2026. Current annual Finger Lakes economic-impact reports provide updated spending, employment and tax estimates but not a directly comparable regional visitor headcount.
How Many Wine Tourists Visit the Finger Lakes?
There is currently no authoritative annual count of unique Finger Lakes wine tourists.
This is one of the most important limitations in the available data. A wine tourist and a winery visit are not necessarily the same statistical unit.
If two people visit four wineries during a weekend, they represent two travelers but eight winery visits. A regional visitor survey might instead measure whether wineries formed part of a trip. An economic-impact study may estimate winery traffic using business counts and assumptions about visitation.
All of those approaches can produce useful information, but their results cannot safely be treated as interchangeable.
This is why current claims such as 1.5 million Finger Lakes wine tourists should be treated cautiously unless a publisher provides a current Finger Lakes-specific methodology. We did not find a primary regional study that supports using 1.5 million as an authoritative current count of unique annual wine tourists.
What does exist is a combination of historical wine-country visitor research, the 2018 regional visitor study, county-level surveys, county wine-industry economic models and current statewide wine-tourism estimates. Together they provide a more defensible picture.
Historical Growth of Finger Lakes Wine Tourism
One of the strongest long-term datasets comes from a New York winery survey conducted by the New York Agricultural Statistics Service and presented by the New York Wine & Grape Foundation.
Cornell University preserves the industry presentation containing the historical data. Its Finger Lakes chart is titled Wine Country Tourists and reports the following figures.[4]
| Year | Finger Lakes wine-country tourists reported |
|---|---|
| 1985 | 217,000 |
| 1995 | 1,077,000 |
| 2000 | 1,945,000 |
| 2003 | 2,879,000 |

The same research gives a statewide wine-country total of 4.137 million in 2003. The Finger Lakes figure of 2.879 million therefore represented roughly 70% of New York’s reported wine-country tourism total in that historical survey.[4]
That helps show just how dominant the Finger Lakes had become within New York wine tourism by the early 2000s.
The series should not, however, simply be extrapolated forward to estimate 2026 visitation. The number of wineries, consumer behavior and tourism measurement methods have all changed substantially.
Why Do Some Older Sources Give Different Numbers?
Some academic publications cite lower estimates for the early 2000s, including approximately 1.2 million Finger Lakes winery visitors in 2000 and 1.6 million in 2003.
The later New York Agricultural Statistics Service material preserved by Cornell instead shows 1.945 million and 2.879 million for those years.
Without the complete survey instruments and processing notes behind both historical series, the discrepancy cannot be resolved confidently. It may reflect differences in participating wineries, geography, survey coverage or the treatment of tourists versus individual winery visits.
For this page, the NY Agricultural Statistics Service series preserved by Cornell is used as the main historical benchmark rather than merging incompatible estimates into one artificial trend.
Finger Lakes Visitor Spending Reached $4.59 Billion in 2024
The strongest current economic data come from Tourism Economics and Empire State Development.
Visitors spent an estimated $4.5865 billion across the official Finger Lakes tourism region in 2024, up 2.1% from 2023.[1]
Visitor activity also supported 55,418 jobs, approximately $2.10 billion in personal income and about $553 million in state and local tax revenue.[1]
| Year | Finger Lakes visitor spending |
|---|---|
| 2019 | $3.261 billion[12] |
| 2020 | $2.017 billion |
| 2021 | $3.275 billion |
| 2022 | $4.091 billion |
| 2023 | $4.492 billion |
| 2024 | $4.587 billion |
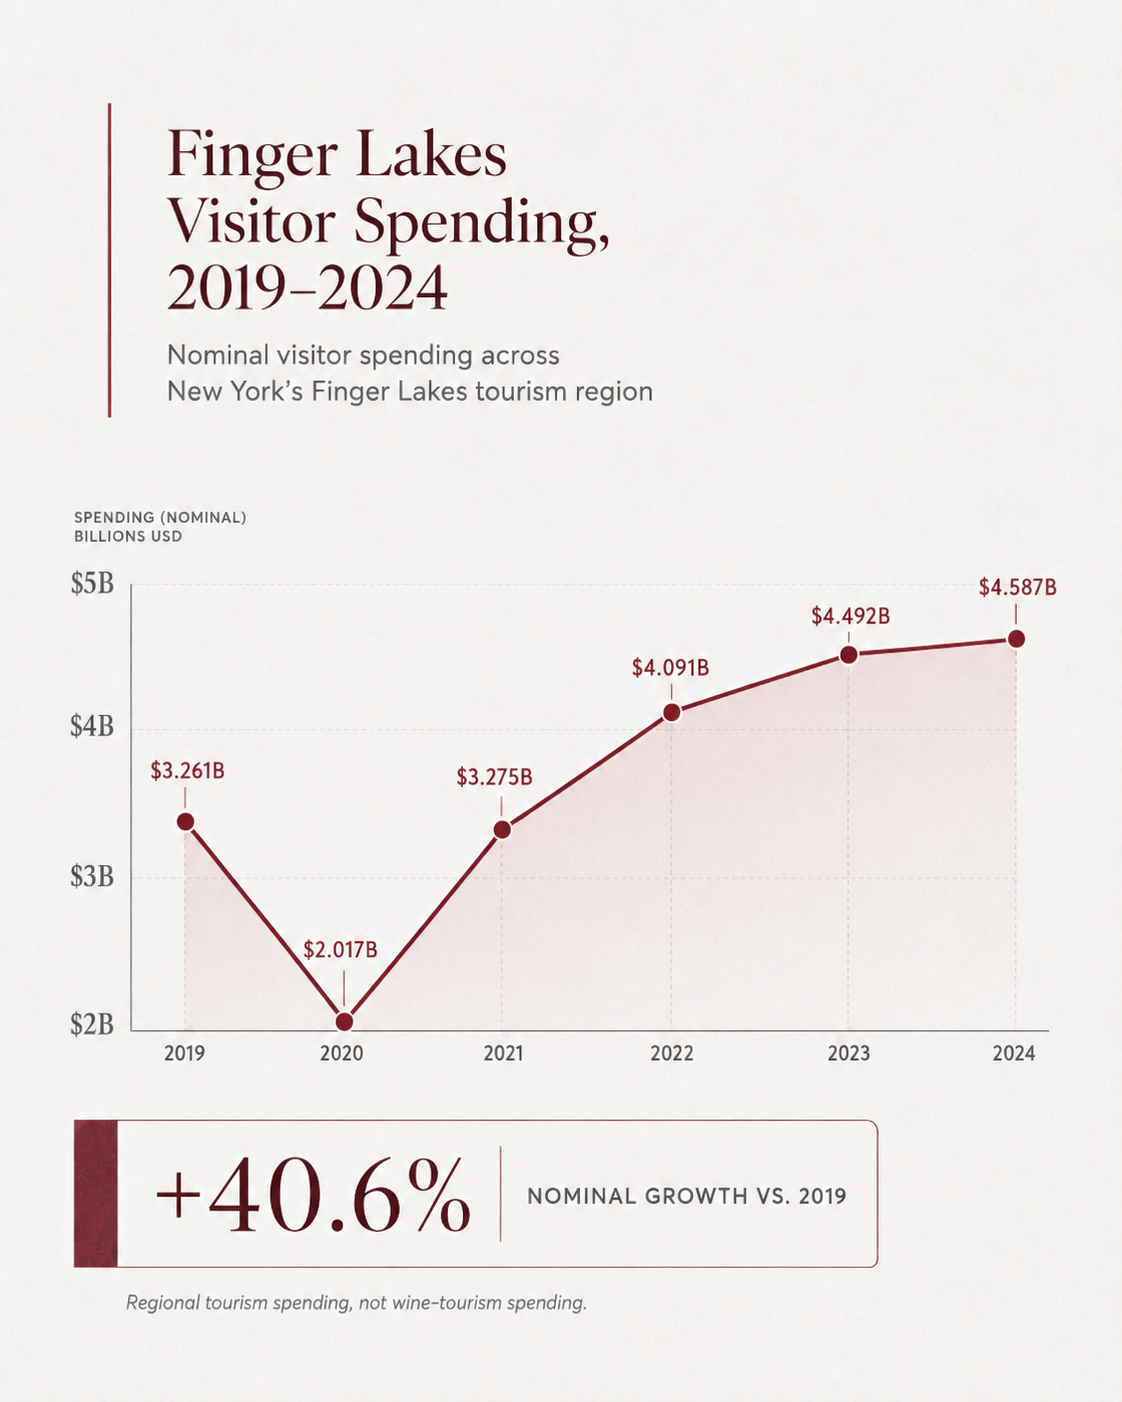
That does not mean 40.6% more travelers visited the region. These are nominal dollar figures, so inflation, accommodation rates and changes in visitor behavior contribute to the increase.
Research note$4.59 billion is not Finger Lakes wine-tourism spending.
The figure covers all visitor activity across New York’s 14-county Finger Lakes tourism region, including Rochester in Monroe County and Syracuse in Onondaga County.
Monroe County accounted for 32% of regional visitor spending in 2024 and Onondaga County another 28%. Together they represented roughly 60% of the regional total.[1]
The $4.59 billion figure therefore cannot be described as winery spending or as the economic impact of Finger Lakes wine tourism.
Where Do Finger Lakes Visitors Spend Their Money?
The 2018 regional visitor research provides something the current annual economic reports do not: a direct indication of the role wineries played within leisure visitor spending.
| Spending category | Share of leisure visitor spending |
|---|---|
| Dining | 27% |
| Lodging | 25% |
| Shopping at wineries | 16% |
| Other shopping | 13% |
| Transportation and fuel | 10% |
| Attractions | 8% |

The 16% winery-shopping share is one of the strongest Finger Lakes-specific wine-tourism statistics available from the regional research. The findings were later preserved in National Park Service research on the Finger Lakes.[2]
It also provides useful context. Winery shopping represented a smaller share of spending than dining or lodging individually, but a larger share than other shopping, transportation or attractions.
We deliberately do not multiply 16% by the full $2.432 billion leisure-spending figure and present the result as a new estimate of Finger Lakes winery spending. The surviving documentation does not establish that such a calculation would use exactly the same denominator, and doing so would create a level of precision the source does not support.
Wine Tourism in the Core Finger Lakes Counties
Wine tourism is not evenly distributed across the wider 14-county tourism region. County-level research provides a clearer view of activity inside the core wine areas.
Seneca County: $152.55 Million in Wine and Grape Tourism Output
Seneca County provides one of the strongest local wine-specific economic datasets.
A county agricultural planning study reproduces a John Dunham & Associates analysis of the wine and grape industries. Unlike general regional tourism totals, the model separates tourism from vineyards, manufacturing and retail.
| Seneca County wine & grape sector | Jobs | Wages | Output |
|---|---|---|---|
| Tourism | 2,256 | $70.33M | $152.55M |
| Wine manufacturing | 304 | $23.04M | $94.71M |
| Wine retail | 296 | $9.69M | $18.47M |
| Vineyards | 123 | $2.25M | $4.65M |
| Total direct impact | 2,984 | $105.73M | $271.45M |
| Total economic impact | 3,056 | $110.24M | $283.94M |
The data relate to the 2019 economic-impact study, so the $152.55 million tourism figure should not be presented as a current 2026 total.
Its value is that tourism is explicitly identified inside the county’s wine-and-grape economy rather than inferred from total county tourism spending.[7]
Cayuga County: 71% of Surveyed Visitors Went to a Winery
The Cayuga County Office of Tourism’s 2011 Market Analysis and Visitor Research provides a different type of evidence: actual visitor-survey behavior.
Among respondents who had made an actual trip to Cayuga County, 71% reported visiting at least one winery.[8]
| Wineries visited | Share of surveyed visitors |
|---|---|
| None | 29% |
| One | 14% |
| Two | 20% |
| Three | 15% |
| Four or more | 22% |
The relevant visitor sample was relatively small at n=94, and the survey dates from 2011. It should therefore not be used to claim that 71% of current Finger Lakes visitors go to wineries.
Its value is behavioral: it shows how frequently wine activity could become part of an actual Finger Lakes itinerary.
The same study reported the following average spending per travel party:
| Expense | Average travel-party spending |
|---|---|
| Lodging | $298.14 |
| Food and meals | $175.33 |
| Shopping | $123.15 |
| Wineries | $76.73 |
| Fuel | $74.59 |
| Attractions and events | $32.15 |
| Total average trip spending | $780.10 |
Among respondents who actually reported winery spending, average expenditure at wineries was approximately $126 per travel party.[8]
Why We Do Not Use the Yates County “500,000 Visitors” Figure
A figure of roughly 500,000 annual winery visitors has appeared for many years in Yates County economic-development material.
The problem is not that the figure could never have been accurate. The problem is that variations of the same round estimate have circulated for many years, while we could not identify a current visitor survey or transparent methodology supporting it as a present-day annual count.
An old statistic remaining on a live webpage is not the same thing as current data. We therefore exclude the 500,000 figure from our current headline statistics.
How Many Wineries Are in the Finger Lakes?
The Finger Lakes Tourism Alliance currently describes the region as home to more than 140 wineries.[6]
An exact count is harder to maintain than it may appear. Different organizations may count production wineries, tasting rooms, satellite tasting facilities or businesses within different geographic definitions of the Finger Lakes.
For that reason, 140+ is a more defensible tourism statistic than presenting an artificially precise count that can become outdated as businesses open, close or add tasting locations.
Finger Lakes American Viticultural Areas
The federal wine-growing geography is more precise than the regional tourism geography.
- Finger Lakes AVA — established in 1982
- Cayuga Lake AVA — established in 1988
- Seneca Lake AVA — established in 2003
The U.S. Alcohol and Tobacco Tax and Trade Bureau defines these AVAs for viticultural and wine-labeling purposes.[5]
How Much Vineyard Land Is in the Finger Lakes?
The 2024 New York Vineyard Report provides one of the most important recent improvements in Finger Lakes wine-industry data. It was the first comprehensive statewide vineyard survey undertaken since the 2011 USDA report.[9]
It also produced two different Finger Lakes acreage measures because two different methodologies were used.
| Finger Lakes vineyard measure | 2024 acreage | Method |
|---|---|---|
| Grower-reported bearing acreage | 5,640 acres | Survey of participating growers |
| Satellite-detected vineyard acreage | 9,035 acres | Satellite imagery and machine-learning analysis |

The 5,640-acre figure represents bearing acreage reported by growers in the Finger Lakes AVA.
The 9,035-acre figure comes from Deep Planet’s remote analysis. The project used satellite imagery and machine-learning models to identify vineyard surface area.[9]
These are not simply two competing estimates of an identical metric. One measures self-reported producing acreage; the other attempts to detect surface area under vine remotely.
Why the acreage numbers differReaders may also encounter a figure of 10,790 acres for the Finger Lakes. Finger Lakes Wine Alliance currently uses 10,790 producing acres in its regional quick facts.[10]
The published 2024 New York Vineyard Report itself gives 5,640 grower-reported bearing acres and 9,035 satellite-detected acres for the Finger Lakes AVA.[9]
Different definitions or underlying datasets therefore appear to be involved. Rather than forcing them into one number, this page keeps the methodology attached to each estimate.
Riesling and Other Finger Lakes Grape Varieties
The same vineyard survey provides a detailed picture of grape varieties reported in the Finger Lakes AVA.
| Grape variety | Reported bearing acres | Share of reported Finger Lakes acreage |
|---|---|---|
| Concord | 1,058 | 19% |
| Riesling | 832 | 15% |
| Niagara | 353 | 6% |
| Aurora / Aurore | 319 | 6% |
| Cabernet Franc | 295 | 5% |
| Catawba | 272 | 5% |
| Chardonnay | 259 | 5% |
| Cayuga White | 225 | 4% |
| Pinot Noir | 200 | 4% |
Riesling is especially important to the region’s modern wine identity. The survey recorded 832 bearing acres of Riesling, approximately 15% of all reported Finger Lakes bearing acreage.
More strikingly, the Finger Lakes contained approximately 90% of all Riesling acreage reported across New York State in the survey.[9]
Concord nevertheless remained the largest single grape variety by reported Finger Lakes acreage. The data show a more varied agricultural landscape than the region’s international association with Riesling alone may suggest.
Finger Lakes Wine Tourism vs. New York State Wine Tourism
Statewide wine-tourism research provides useful context, but New York State figures should never be relabeled as Finger Lakes statistics.
The 2025 Economic Report on Wine, prepared by John Dunham & Associates for WineAmerica, estimates that New York’s wine-country regions collectively generate:
| New York State wine-industry metric | 2025 estimate |
|---|---|
| Wine-tourism visits | 2.84 million |
| Annual tourism expenditures | $541.90 million |
| Wine producers / facilities | 507 |
These are New York State figures. The study does not provide a current Finger Lakes share that can simply be separated from the statewide total.[11]
This distinction also matters when comparing statewide wine-industry economic-impact studies from different years. Earlier studies produced different tourism estimates using different modeling assumptions.
Those datasets should not be plotted as a continuous time series without first establishing that their methodologies and definitions are comparable. A change in a modeled estimate is not necessarily equivalent to the same percentage change in actual tourism demand.
How to Read These Numbers: Surveys, Models and Geography
Many apparent contradictions in Finger Lakes wine-tourism statistics disappear once the type of measurement and the geographic boundary are identified.
| Data type | What it measures | Example used on this page |
|---|---|---|
| Regional visitor survey | Traveler behavior, trip characteristics and reported spending | FLTA / Travel Market Insights |
| Winery survey | Wine-country activity reported through industry research | New York Agricultural Statistics Service |
| County visitor survey | Behavior of a specific visitor sample | Cayuga County 2011 |
| Economic-impact model | Estimated sector activity and wider economic effects | Seneca County / John Dunham & Associates |
| Annual tourism economic model | Regional spending, employment, income and taxes | Tourism Economics |
| Grower survey | Self-reported vineyard acreage | NYWGF 2024 Vineyard Report |
| Satellite analysis | Vineyard surface identified remotely | Deep Planet / NYWGF |
A visitor is not automatically a wine tourist. A winery visit is not automatically one unique person. One traveler can produce several winery visits during the same trip.
Likewise, visitor spending, economic output and total economic impact describe different economic measures.
The Tourism Region and the AVA Are Different
New York tourism reporting uses a broad 14-county Finger Lakes tourism region covering Cayuga, Chemung, Cortland, Livingston, Monroe, Onondaga, Ontario, Schuyler, Seneca, Steuben, Tioga, Tompkins, Wayne and Yates counties.
This geography includes Rochester and Syracuse and is the region behind the $4.59 billion 2024 visitor-spending total.
The Finger Lakes AVA is instead a federally defined viticultural area used for wine-growing and labeling purposes. Individual wine-trail areas around lakes such as Seneca, Cayuga, Keuka and Canandaigua create another practical tourism geography.
Finger Lakes tourism region ≠ Finger Lakes AVA ≠ individual wine-trail area.
A statistic can therefore be completely accurate for one of these geographies and misleading when attached to another.
What We Still Do Not Know About Finger Lakes Wine Tourism
Despite the amount of tourism and wine-industry research available, several basic questions still lack a strong current public dataset.

- Current unique annual wine tourists: there is no transparent, current Finger Lakes-wide estimate.
- Current annual winery visits: the historical winery-survey series does not continue in a directly comparable form through 2026.
- Current Finger Lakes wine-tourism spending: the $4.59 billion regional total includes all tourism, while statewide wine studies are geographically too broad.
- Current spending per wine tourist: older county surveys provide useful historical evidence but not a representative current regional benchmark.
- Current wine-tourist demographics: detailed public research exists, but much of it is too old or geographically narrow to represent the full 2026 market confidently.
- Current share of visitors who visit a winery: historical studies provide evidence of strong winery participation, but no current region-wide percentage is available with transparent methodology.
The absence of these figures is itself an important finding.
It means claims such as “Finger Lakes wine tourism generates $1.5 billion”, “wine tourism is worth $3 billion to the Finger Lakes” or “1.5 million wine tourists visit each year” should not be repeated as established statistics unless the underlying regional study and methodology can be identified.
Identifying a genuine data gap is preferable to manufacturing precision by combining unrelated visitor counts, statewide models and regional spending figures.
Data Quality and Source Selection
This page gives priority to government, institutional and research sources. Secondary sources are used mainly where an original historical report is no longer readily available online.
The main evidence comes from Tourism Economics and Empire State Development for current regional tourism economics; the New York Wine & Grape Foundation for vineyard data; Cornell University and New York Agricultural Statistics Service research for historical wine tourism; the National Park Service for preserved Finger Lakes visitor research; U.S. TTB records for AVA definitions; county studies for local visitor and economic evidence; and WineAmerica / John Dunham & Associates for current statewide wine-industry context.
We do not treat a statistic as current simply because it remains on a live webpage. We also do not convert statewide wine statistics into Finger Lakes statistics or general Finger Lakes visitor spending into wine-tourism spending.
Where credible sources use different figures, the difference is retained and explained rather than hidden.
Sources and References
- Tourism Economics / Empire State Development.
Economic Impact of Visitors to New York — Finger Lakes 2024.
Regional visitor spending, employment, income, taxes and county-level data.
View report. - National Park Service.
Finger Lakes National Heritage Area Feasibility Study.
Preserves and cites findings from the Finger Lakes Tourism Alliance / Travel Market Insights research.
View report. - Travel Market Insights / Finger Lakes Tourism Alliance.
Comprehensive Regional Travel and Tourism Study and Recommendations, published 2019 using 2018 data.
The original FLTA PDF is no longer reliably available; contemporaneous reporting preserved the 5.56 million visitor, 4.86 million leisure visitor, 3.4-day, 2.4-night and $2.432 billion results.
View contemporary study summary. - Cornell University eCommons / New York Wine & Grape Foundation / New York Agricultural Statistics Service.
Historical New York winery-survey material including the Finger Lakes Wine Country Tourists series.
View archived research. - U.S. Alcohol and Tobacco Tax and Trade Bureau.
Federal American Viticultural Area establishment records.
View AVA records. - Finger Lakes Tourism Alliance.
Current regional winery information and directory.
View Finger Lakes wineries. - Seneca County Agricultural and Farmland Enhancement Plan.
Wine and grape economic-impact data including the tourism component of the county wine economy.
View planning document. - Cayuga County Office of Tourism.
2011 Market Analysis and Visitor Research.
Historical visitor behavior, winery visitation and travel-party spending.
View visitor research. - New York Wine & Grape Foundation.
2024 New York Vineyard Report.
Grower-reported acreage, Finger Lakes grape varieties and Deep Planet satellite vineyard analysis.
View vineyard report. - Finger Lakes Wine Alliance.
Current regional wine-industry quick facts, including the 10,790-acre estimate.
View quick facts. - WineAmerica / John Dunham & Associates.
2025 Economic Report on Wine — New York.
Current statewide wine-tourism visits and expenditure estimates.
View New York report. - Tourism Economics / Empire State Development.
Economic Impact of Visitors in New York — Finger Lakes 2019.
Used for the pre-pandemic 2019 visitor-spending benchmark of $3.261 billion.
View 2019 report.
Cite This Page
Researchers, journalists, tourism organizations, wineries and other publishers are welcome to cite statistics and analysis from this page.
Suggested citation:
Finger Lakes Wine Guide. “Finger Lakes Wine Tourism Statistics 2026: Visitors, Spending, Wineries & Vineyard Data.” Updated August 2026.
When reproducing a statistic, table or chart compiled from this page, please link back to this page so readers can review the original sources, definitions and methodology.
This dataset will be updated as new Finger Lakes visitor, winery, vineyard and economic-impact research becomes available.